Overall Analysis
- Gold has reached an all-time high and is holding at that level. The price is forming an ascending triangle, indicating a potential upward move.
- Silver fell sharply during Wednesday’s trading session, and lower levels may be retested. High volatility and a lack of structure make it challenging for traders.
Gold Chart Analysis
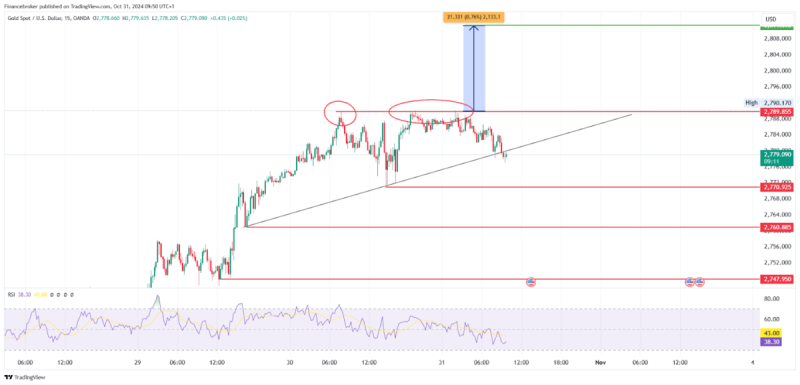
Gold/USD 15-Minute Chart (Source: TradingView)
During the trading session on October 30, 2024, gold reached a new all-time high of $2,790 and continued to hover around this level.
Currently, the price is forming an ascending triangle pattern, and a breakout could trigger significant buying in gold.
Traders can consider three conditions for trading gold now that the price has already risen.
- Traders can trigger a buying position if the price breaks out of the ascending triangle and closes above the $2,789.855 level, targeting $2,811 on a trailing basis, with a stop loss set below the previous swing low.
- If the price moves back into the ascending trendline channel, consider entering a buying position with a target of $2,789.855 and a stop loss below the previous swing low.
- In this scenario, a selling position may be triggered if the price breaks below $2,770.925, which acts as the neckline for a double-top formation. A selling position can be taken if the price closes below this level, with targets of $2,760.885 and $2,747, and a stop loss above the previous swing high.
Silver Chart Analysis
Silver/USD 15-Minute Chart (Source: TradingView)
During the trading session on October 30, 2024, silver continued its move toward a declining trend. On a higher time frame, the price appears to be moving in a ‘peanut’ pattern.
Looking at the chart, we can see that the price faced rejection at the 34.542 level and moved down to test the 33.400 level. The price is forming a lower high, lower low pattern, indicating strength in the downtrend.
If considering an entry, the price is currently finding support from the trendline and facing resistance from another trendline. If the price holds support and breaks the resistance trendline, traders may trigger a buying entry with targets of 34.00 and 34.2 and a stop loss below the previous swing low.
Please note that silver is experiencing high volatility. It’s advisable to avoid trades until the price shows a more positive behavior.
The post Gold & Silver Volatility: A Strategic Analysis for Traders appeared first on FinanceBrokerage.


